Qu'est-ce que l'Inflation, définition ?
L'inflation est une augmentation générale et durable des prix ayant pour conséquence une perte de pouvoir d'achat de la monnaie.
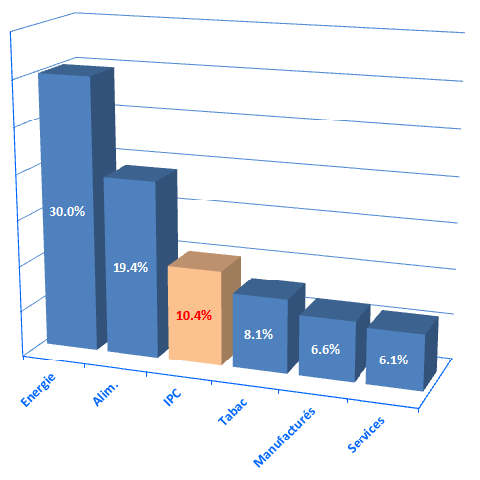
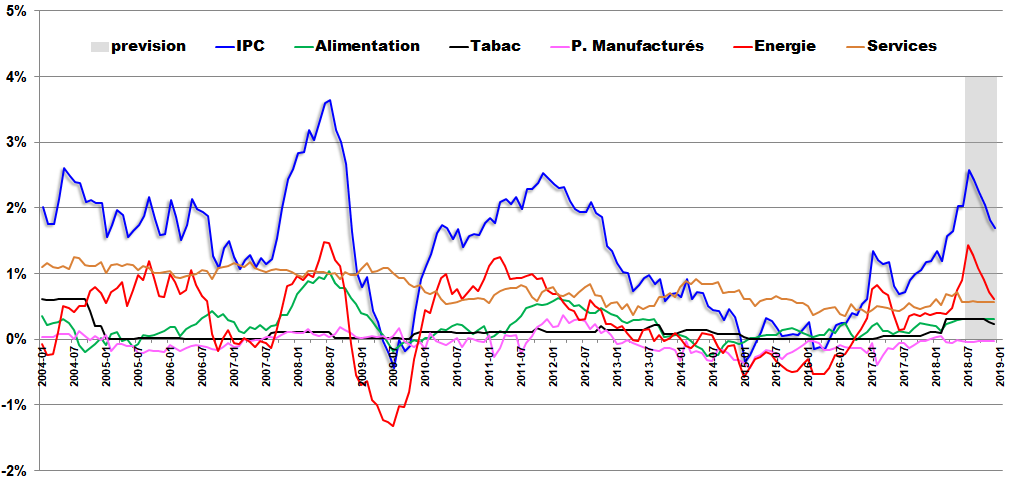
Pour les produits de consommation courante, alimentation, services, énergie, manufacturés, tabacs, c'est l'Indice des Prix à la Consommation ou IPC qui la mesure en France.
L'inflation de chaque produit est mesurée individuellement, puis moyennée suivant une pondération définie par le
panier représentatif moyen Insee.
Pondérations du Panier Insee :
Alimentation : 14.7%
Alcool et Tabac : 4%
Habillement : 3.5%
Logement : 15.5%
Equipement du logement : 5.3%
Santé : 11.3%
Transports : 14.2%
Communication : 2.6%
Loisirs et Culture : 8.4%
Enseignement : 0.1%
Hébergement et Restauration : 6.6%
Autres Biens et Services : 13.8%
Quel est le niveau d'Inflation acceptable ?
Economiquement parlant, il est considéré bon d'avoir un niveau d'inflation faible et contrôlé, la BCE vise un niveau de 2% pour l'Europe.
Le fait qu'il soit contrôlé permet aux acteurs économiques de se projeter avec sérénité dans l'avenir pour les investissements, les achats long terme...
Avoir un niveau non nul incite à placer ses économies pour qu'elles ne perdent pas de la valeur et peut soutenir l'activité (bourse).
Quelles sont les causes de l'Inflation des prix ?
- Demande supérieure à l'offre disponible:
En période de pénurie relative, les acheteurs sont prêts à payer plus cher un produit, un service, les vendeurs ont tendance à augmenter leurs prix.
Ceci se produit en période de forte croissance, le temps d'ajuster les capacités de production à la demande, ou en période de crise affectant significativement les capacités de production ou générant des pénuries de matières premières.
- Hausse des coûts constitutifs des prix :
Hausse des salaires supérieure à l'inflation, hausse des produits énergétiques, hausse des matières premières...
Ces hausses si elles durent peuvent enclencher un effet boule de neige ou spirale inflationniste échappant à tout contrôle.
- Dépréciation de notre monnaie sur le marché des changes:
Lorsque l'Euro perd de sa valeur par rapport aux devises mondiales, nous payons plus cher les matières premières ou produits manufacturés importés, ce qui augmente leur prix sur notre marché intérieur.
- Excès de masse monétaire :
Lorsque le total de la masse monétaire en circulation est excédentaire par rapport à l'ensemble des biens et services disponibles sur le marché, ceci peut générer de l'inflation. Nous avons moins d'exemples de cet effet dans les économies modernes, mais par le passé on peut se souvenir de la stratégie "faire tourner la planche à billets" conduisant au bout du bout à une dévaluation de notre monnaie.
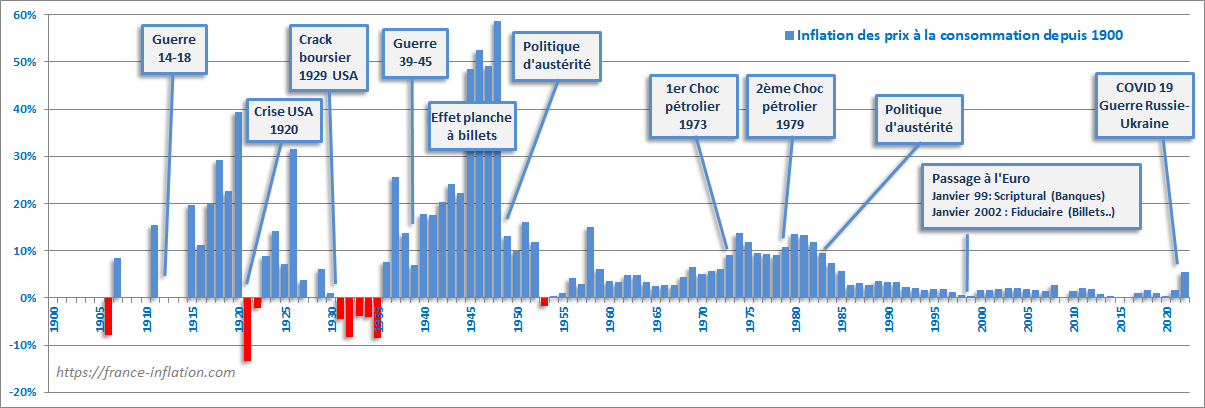
Histoire de l'inflation en France depuis 1900
L'historique de l'inflation depuis 1900 en France révèle tous les effets décrits dans les causes de l'inflation.
- Après guerres 14-18 et 39-45 :
Le pays est en ruine, il faut tout reconstruire, s'ensuit une période de très forte croissance, l'offre est en retard par rapport à la demande.
Du fait de la difficulté à rembourser les dettes de guerre, le Franc perd de son attractivité et est dévalué à plusieurs reprises, rendant les importations plus chères. Ceci génère de l'inflation qui atteint alors des niveaux records avec des pointes annuelles à près de 40% en 1920 (années folles) et 60% en 1948.
- Crise économique mondiale suite au crack boursier de 1929 aux USA :
Touche la France avec un peu de retard en 1931, son PIB baisse, le gouvernement baisse ses coûts notamment par les salaires. On entre en déflation jusqu'en 1935.
- Fin des accords Bretton-Woods sur la convertibilité du dollar en or, premier choc pétrolier de 1973 :
Les Etats Unis mettent fin à la convertibilité du Dollar en Or en 1971 car plus tenable, le dollar se dévalue entrainant une envolée du cours du pétrole dont le prix est multiplié par quatre.
L'inflation repart fortement à la hausse avec une pointe en 1980 à 14% et reste élevée jusqu'en 1983.
- Politique d'austérité de 1983 :
L'arrivée des socialistes au pouvoir en 1981 se traduit par une "politique d'état providence" dans un premier temps, vite remplacée par une "politique d'austérité" devant l'inefficacité de la relance et la mise à mal des finances publiques.
Ceci passe principalement par une désindexation des salaires par rapport à l'inflation pour stopper la spirale inflationniste.
L'inflation est contenue en dessous de 5% à partir de 1985 et même à 2% dans les années 2000.
- Crise Covid de 2020 et Guerre Russie contre Ukraine de 2022 :
La gestion politique de la Crise Covid passe par des confinements successifs avec une mise à l'arrêt de tout le pays.
En sortie de crise, la demande repart à la hausse comme contrecoup des confinements et des restrictions imposés alors que les stocks de produits sont vides et que le système de production mondial nécessite du temps pour un retour à pleine capacité.
Ces tensions offre/demande génèrent des hausses de prix.
Se rajoute la guerre Russie Ukraine en février 2022 qui va complètement déstabiliser le marché mondial de l'énergie, pétrole et gaz dont le cours s'envole.
Cela induit une forte inflation dans les produits énergétiques dans un premier temps, avec une diffusion à tous les autres produits dans une deuxième temps.
L'inflation repart à la hausse avec des niveaux entre 5% et 10%.

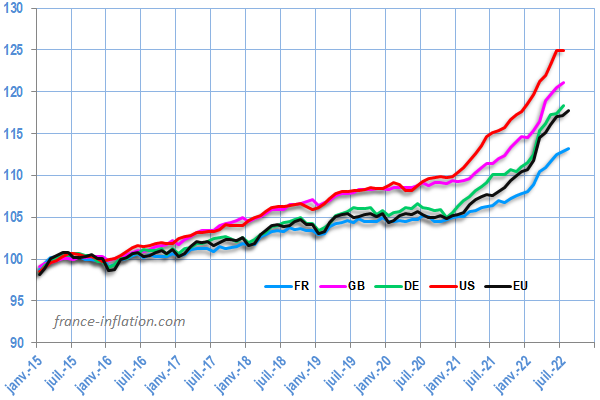 L'indice des prix augmente fortement depuis début 2021 dans de nombreux pays.


 Le taux du Livret A est gelé à 0.75% jusqu'en Janvier 2020, sur décision du ministre des finances, Bruno Lemaire.


 Sainte Zita 08h43